Quickly inspect the distribution of numeric variables using histograms.
Arguments
- data
A non-empty data frame or tibble containing at least one numeric variable.
- vars
A character vector of numeric variable names contained in
data. Default valueNULLwill produce plots for every numeric variable in the dataset.- fill_colour
An R-supported colour name or hex value used to fill the bars of the histogram. Default value is "grey30".
- title
A non-empty string for the title of the plot. Default value
NULLresults in no title being displayed.- bins
A positive integer specifying the number of bins in the histogram. Default value is
15.- ...
Additional
ggplot2arguments passed togeom_histogramlayer for customizing the plot output.
Details
inspect_normality uses ggplot2 to produce histograms of numeric variables to visualize their distributions. Any valid arguments that can be passed to a geom_histogram layer in ggplot2 may also be passed to inspect_normality to modify the plot outputs.
Examples
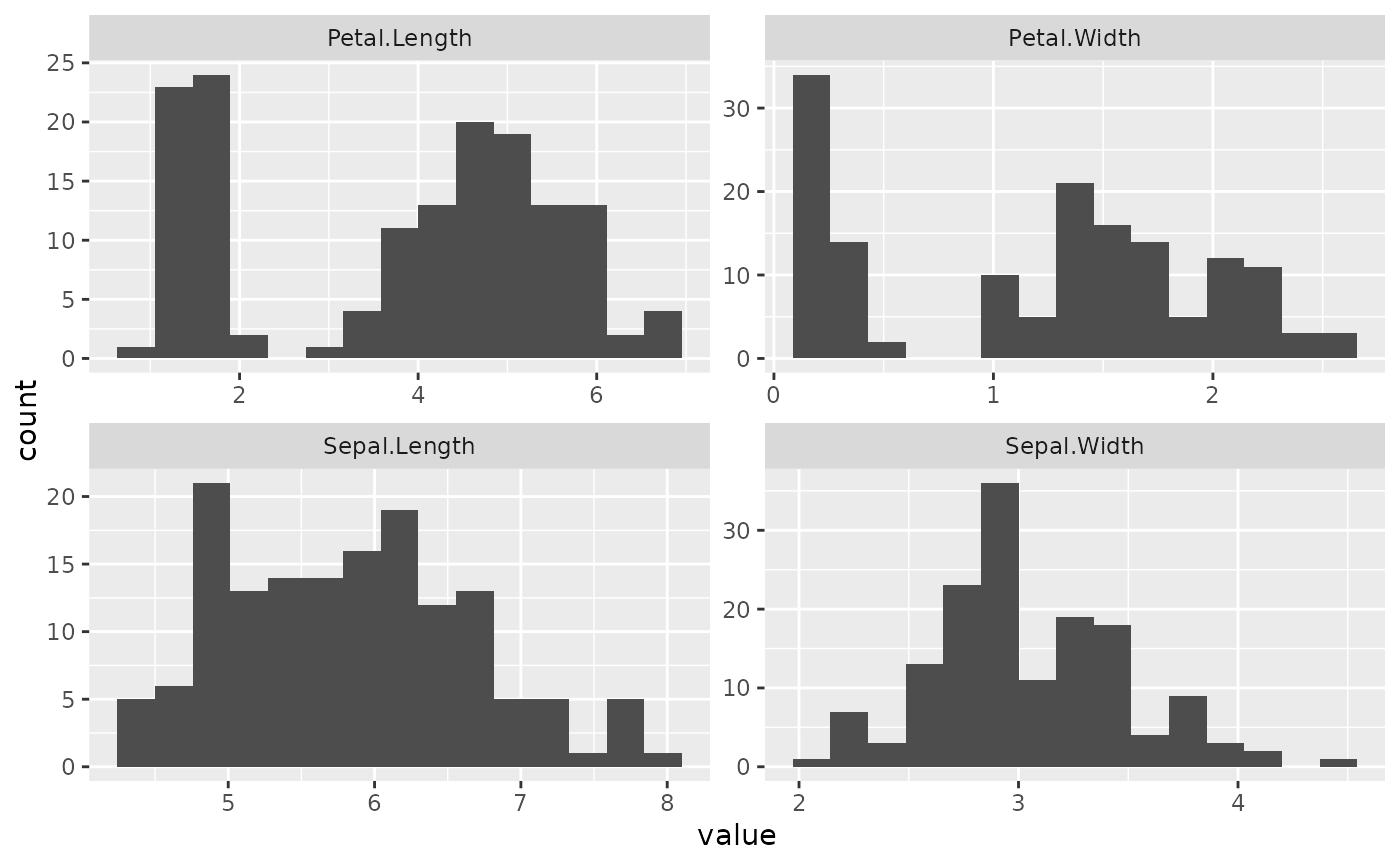
# Basic usage
inspect_normality(iris)
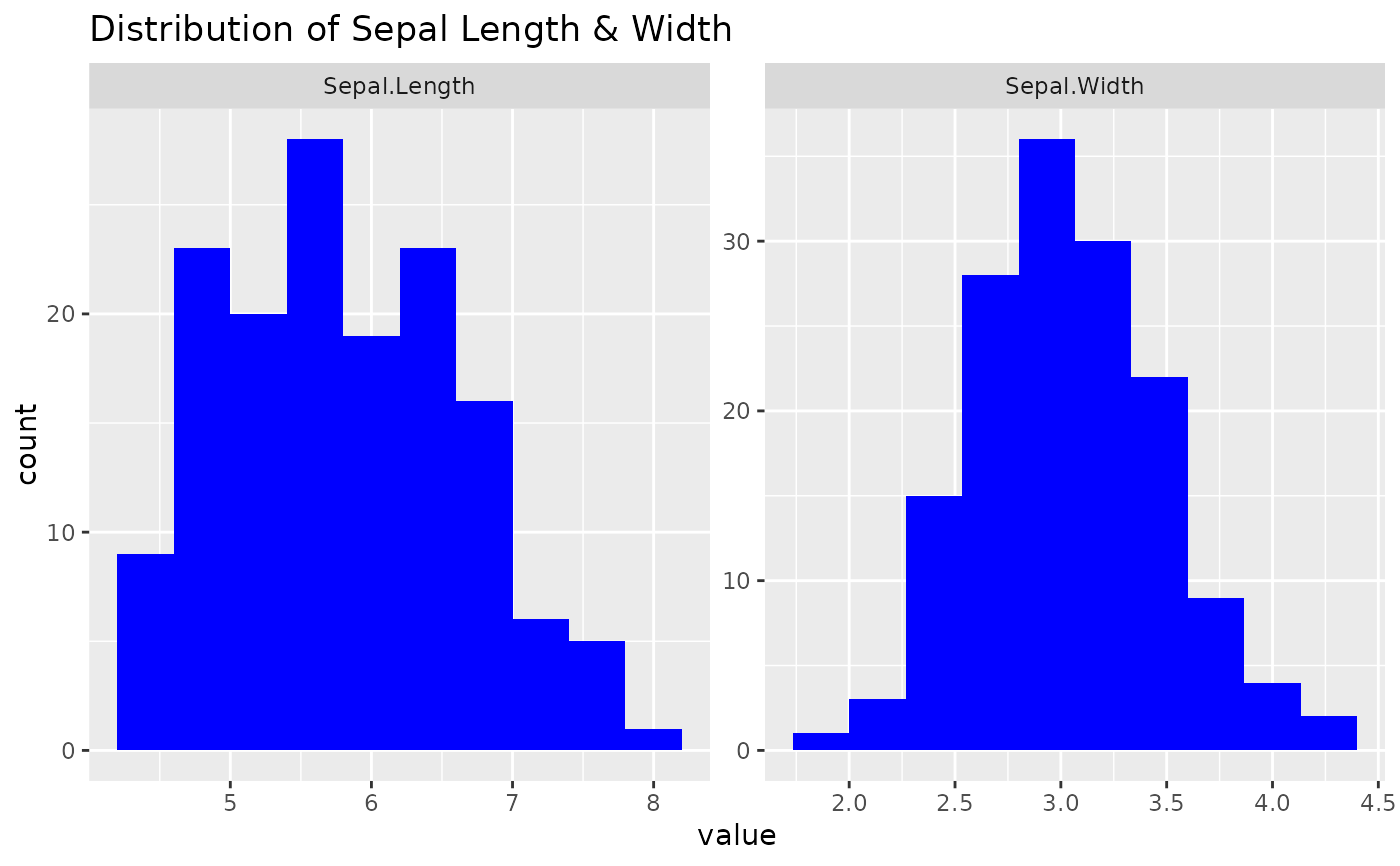
 # Advanced usage
# Specify the variables to inspect and modify the plot appearance
inspect_normality(data = iris,
vars = c("Sepal.Length", "Sepal.Width"),
fill_colour = "blue",
title = "Distribution of Sepal Length & Width",
bins = 10)
# Advanced usage
# Specify the variables to inspect and modify the plot appearance
inspect_normality(data = iris,
vars = c("Sepal.Length", "Sepal.Width"),
fill_colour = "blue",
title = "Distribution of Sepal Length & Width",
bins = 10)